
In today’s dynamic IT landscape, effective database monitoring is a cornerstone of maintaining optimal performance, preemptively identifying issues, and ensuring overall system health. Prometheus, an open-source monitoring and alerting toolkit, serves as a robust solution for monitoring various components of your infrastructure, including databases. This blog post will guide you through the process of setting up MSSQL database monitoring using Prometheus and the SQL Exporter tool within a Kubernetes environment. We’ll assume that Prometheus is already installed using Helm.
Why Monitor MSSQL Databases?
Monitoring MSSQL databases is crucial for several reasons:
- Performance Optimization: Identifying and addressing performance bottlenecks ensures efficient database operation.
- Issue Detection: Early discovery of issues like slow queries, resource contention, or hardware failures helps prevent downtime.
- Capacity Planning: Monitoring aids in understanding resource utilization patterns, facilitating future capacity planning.
- Security: Monitoring database access and activity is crucial for detecting potential security threats and unauthorized access.
Getting Started
Before diving into the setup, ensure you have the following prerequisites:
- A running Kubernetes cluster.
- Helm installed on your Kubernetes cluster.
- Access to the MSSQL database you want to monitor.
- The SQL Exporter tool, which you can find on GitHub here.
Step 1: Install Prometheus with Helm
Assuming Helm is installed, add the Prometheus Helm repository:
helm repo add prometheus-community https://prometheus-community.github.io/helm-charts
helm repo update
Install Prometheus using Helm:
helm install prometheus prometheus-community/kube-prometheus-stackStep 2: Deploy SQL Exporter
Create a Kubernetes deployment file, e.g., deploy.yaml, with the following content:
apiVersion: apps/v1
kind: Deployment
metadata:
  name: sql-exporter
  labels:
    app: sql-exporter
spec:
  replicas: 1
  selector:
    matchLabels:
      app: sql-exporter
  template:
    metadata:
      labels:
        app: sql-exporter
    spec:
      containers:
      - name: sql-exporter
        image: awaragi/prometheus-mssql-exporter:latest
        env:
        - name: SERVER
          value: "your-mssql-server"
        - name: USERNAME
          value: "your-username"
        - name: PASSWORD
          value: "your-password"
        - name: DEBUG
          value: "app"
        - name: PORT
          value: "1433"
        ports:
        - containerPort: 4000
---
apiVersion: v1
kind: Service
metadata:
  name: sql-exporter
spec:
  selector:
    app: sql-exporter
  ports:
    - port: 4000
      targetPort: 4000
Replace placeholders with your MSSQL server details.
Apply the deployment:
kubectl apply -f deploy.yamlStep 3: Configure Prometheus to Scrape SQL Exporter
Create values.yaml and paste following
prometheus:
  prometheusSpec:
    additionalScrapeConfigs:
      - job_name: sql-exporter
        static_configs:
          - targets: [sql-exporter:4000]
Step 4: Restart Prometheus
If Prometheus is running as a Helm release, you can upgrade it to apply the new configuration:
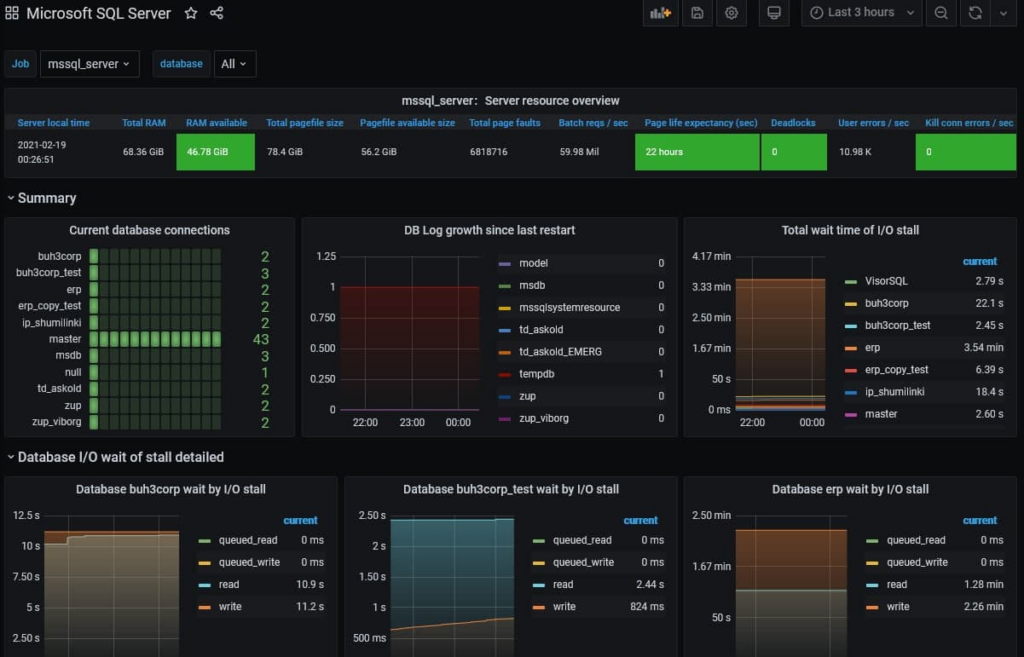
helm upgrade -f values.yaml prometheus prometheus-community/kube-prometheus-stack --namespace defaultHere are some suggestions on available Grafana dashboards.
the result look like this 🔥
Congratulations! You’ve successfully set up MSSQL database monitoring using Prometheus and SQL Exporter within a Kubernetes environment. This scalable and containerized approach allows for seamless integration into your Kubernetes infrastructure. Continuous monitoring remains paramount for maintaining optimal functionality and preventing potential issues in your evolving database environment.