In this tutorial, it is described how to configure Hard Disk Sentinel to create and automatically update an XML file which contains all detected status information. After that, using this XML file to integrate it with PRTG monitoring.
Hard Disk Sentinel Configuration
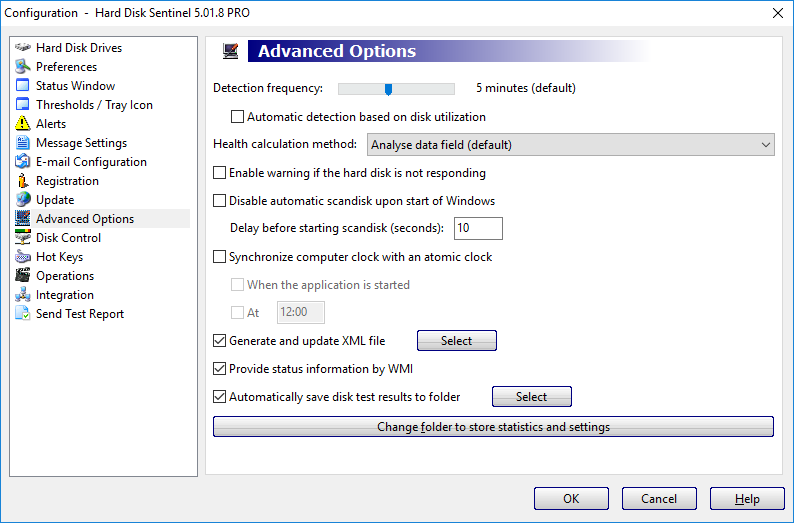
Enable Configuration -> Advanced Options -> Generate and update XML file. By default, this saves HDSentinel.xml file in the folder where the software installed. By the button next to the option, it is possible to select the target location of the XML file. The XML file updated automatically based on the configured detection frequency (which can be adjusted by the slider on the top of the Advanced Options page, by default once per every 5 minutes).
 Script writing
Below is the example of the PowerShell script:
1. Check the url, it may differs from yours. Make sure to replace localhost with your ip adress or domain name.
2. Disk_Information_Disk_0 – you can find it in XML file, there’s output for every of your disk. Make sure to change this to your desired disk.
Create file script.ps1 and paste the content below:
$result = Invoke-WebRequest -Uri "http://<strong>localhost</strong>:61220/xml" -ErrorAction SilentlyContinue -UseBasicParsing

if ($result.StatusCode -ne 200){
write-host ""
write-host "1"
write-host "HTTP Request Failed"
write-host ""
Exit
}

[xml] $xdoc = $result.Content

#Write-Output $result.Content
#Write-Output $xdoc

foreach ($xmlnode in $xdoc.Hard_Disk_Sentinel.Physical_<strong>Disk_Information_Disk_0</strong>.Hard_Disk_Summary) {

#Write-Output "$($xmlnode.Logical_Drive_s)"
#Write-Output "$($xmlnode.Health)"
}

$a = $xmlnode.Health
$a = $a -replace "[%]",""
If ($a -eq "100 ") {
write-host $a,":OK"
exit 0
}
Else {
write-host $a,":CHECK DISK!"
exit 2
}
Copy this script to your PRTG sensors folder, for example:
c:\Program Files (x86)\PRTG Network Monitor\Custom Sensors\EXE\Creating PRTG custom sensor
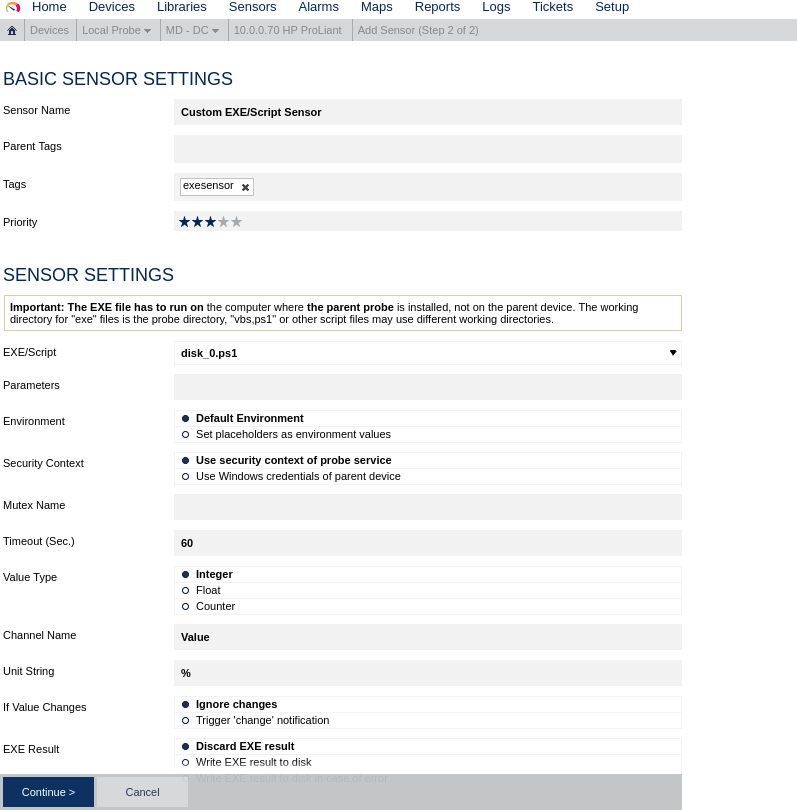
- Navigate to PRTG, device you want to monitor and add a new sensor.
- Find there Custom EXE/Script Sensor and choose your new script
- Change Unit String field to % and continue

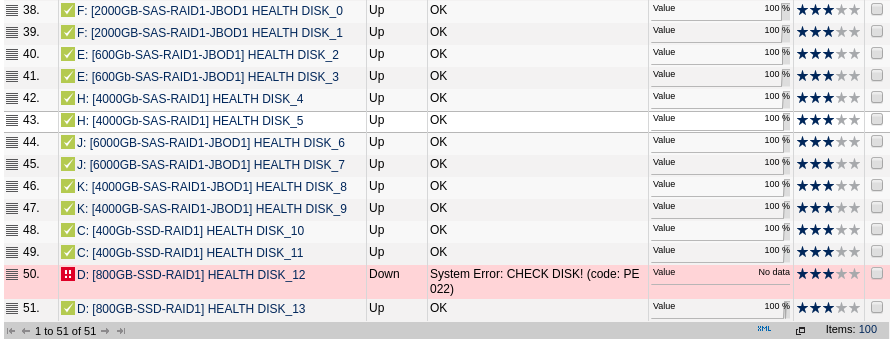
…and the result

