Monitoring Kafka metrics is essential for maintaining the health and performance of your Kafka clusters. By using Prometheus and Grafana, you can create a robust monitoring solution to keep an eye on Kafka metrics. This post will guide you through setting up Kafka metrics monitoring in a Kubernetes environment using Kafka Exporter, Prometheus, and Grafana.
Prerequisites
Before we start, make sure you have the following:
- A running Kubernetes cluster.
- Kafka cluster deployed in your Kubernetes cluster.
- Prometheus and Grafana deployed in your Kubernetes cluster.
Step 1: Deploy Kafka Exporter
Kafka Exporter is a tool that extracts Kafka metrics and exposes them to Prometheus. Here’s how to deploy Kafka Exporter in your Kubernetes cluster.
Create a deployment file named kafka_exporter.yaml with the following content:
apiVersion: apps/v1
kind: Deployment
metadata:
  name: kafka-exporter
  labels:
    app: kafka-exporter
spec:
  replicas: 1
  revisionHistoryLimit: 5
  selector:
    matchLabels:
      app: kafka-exporter
  template:
    metadata:
      labels:
        app: kafka-exporter
    spec:
      containers:
      - name: kafka-exporter
        image: danielqsj/kafka-exporter
        imagePullPolicy: IfNotPresent
        ports:
        - containerPort: 9308
        args: ["--kafka.server=kafka:9092"]
---
apiVersion: v1
kind: Service
metadata:
  name: kafka-exporter
spec:
  selector:
    app: kafka-exporter
  ports:
    - protocol: TCP
      port: 9308
      targetPort: 9308
  type: ClusterIP
Apply the deployment file:
kubectl apply -f kafka_exporter.yamlStep 2: Configure Prometheus to Scrape Kafka Exporter Metrics
Update your Prometheus configuration to scrape metrics from the Kafka Exporter. Modify your values.yaml file for Prometheus with the following additional scrape configuration:
prometheus:
  prometheusSpec:
    additionalScrapeConfigs: |
      - job_name: 'kafka_exporter'
        static_configs:
          - targets: ['exporter-ip-address:9308'] # Replace 'exporter-ip-address' with the actual IP address of your Kafka Exporter
Apply the updated values.yaml file to your Prometheus setup:
helm upgrade --install prometheus stable/prometheus-operator -f values.yamlStep 3: Set Up Grafana Dashboard
Grafana provides a powerful way to visualize your metrics. You can use an existing Grafana dashboard for Kafka Exporter metrics. Import the dashboard using the following steps:
- Open your Grafana UI.
- Navigate to “Dashboards” > “Import”.
- Enter the dashboard ID
7589and click “Load”. - Select the Prometheus data source you configured earlier.
- Click “Import”.
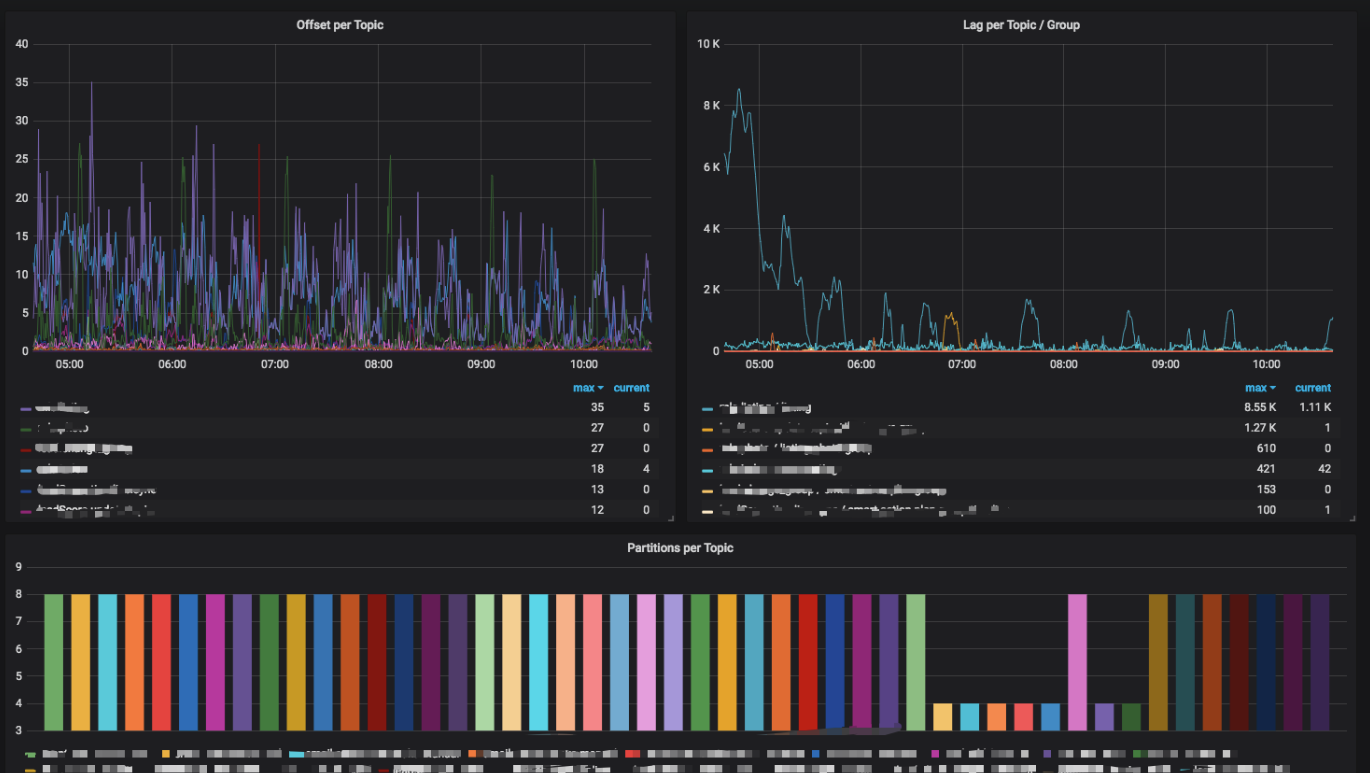
This will set up a pre-configured Kafka Exporter overview dashboard.
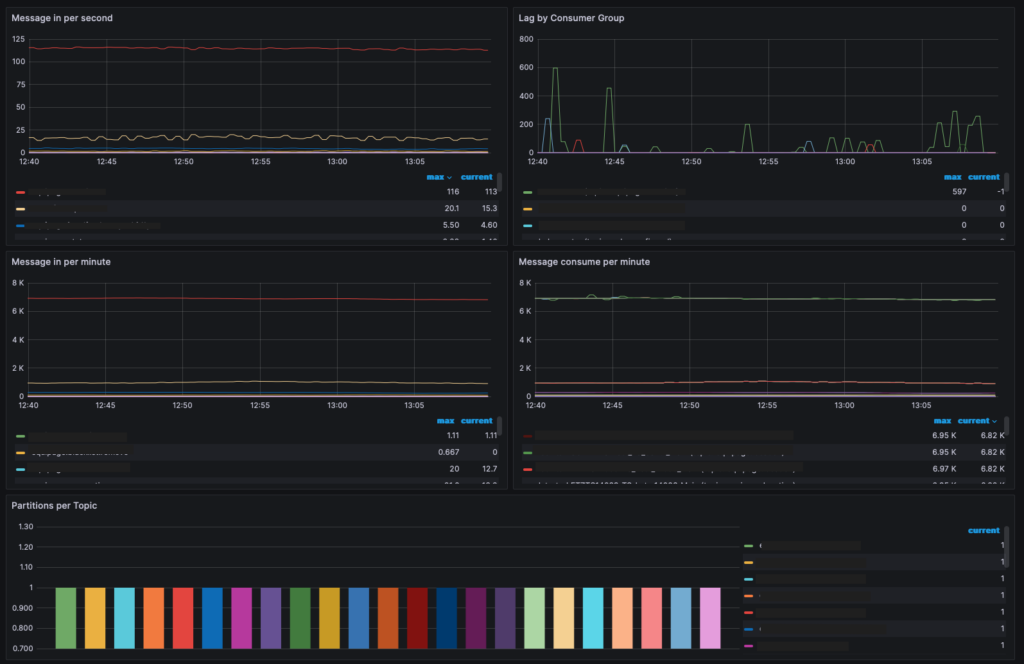
By following these steps, you have successfully set up Kafka metrics monitoring using Prometheus and Grafana in your Kubernetes cluster. This setup provides you with valuable insights into your Kafka cluster’s performance and health, enabling you to take proactive measures to ensure smooth operation.