In the world of microservices and containerisation, Kubernetes has emerged as a powerful tool for orchestrating and managing containerised applications. To ensure the stability and performance of these applications, monitoring plays a crucial role. In this guide, we’ll delve into how you can effectively monitor your Ingress Nginx controller using Prometheus and Grafana, two popular tools in the monitoring landscape.
Understanding the Components
Ingress Nginx Controller:
The Ingress Nginx controller is an essential part of Kubernetes that manages external access to services within the cluster. It acts as a reverse proxy, routing incoming traffic to the appropriate services based on defined rules.
Prometheus:
Prometheus is an open-source monitoring and alerting toolkit. It collects metrics from configured targets, stores them, and provides a powerful querying language to analyse and alert on this data.
Grafana:
Grafana is a widely used open-source platform for monitoring and observability. It offers visually appealing and customisable dashboards that can be used to visualise data from various sources, including Prometheus.
Setting Up Monitoring
Step 1: Install Prometheus
Begin by installing Prometheus in your Kubernetes cluster. You can use Helm, Kubernetes manifests, or other deployment methods. Configure Prometheus to scrape metrics from the Ingress Nginx controller by specifying the controller’s metrics endpoint.
Get Helm Repository Info
helm repo add prometheus-community https://prometheus-community.github.io/helm-charts
helm repo update
helm install prometheus prometheus-community/kube-prometheus-stackIf you want to customize the configuration, create a custom YAML file (e.g., prometheus.yaml). Copy the default values from the Helm Chart and modify them as per your requirements. Then, install Prometheus using your custom value.yaml file:
grafana:
  enabled: false
  persistence:
    enabled: true
alertmanager:
  enabled: false
kubeStateMetrics:
  enabled: false
nodeExporter:
  enabled: false
helm install -f prometheus.yaml prometheus prometheus-community/prometheusor upgrade the existing installation with:
helm upgrade -f values.yaml prometheus prometheus-community/kube-prometheus-stackRe-configure Prometheus
Since Prometheus is running in a different namespace and not in the ingress-nginx namespace, it would not be able to discover ServiceMonitors in other namespaces when installed. Reconfigure your kube-prometheus-stack Helm installation to set serviceMonitorSelectorNilUsesHelmValues flag to false. By default, Prometheus only discovers PodMonitors within its own namespace. This should be disabled by setting podMonitorSelectorNilUsesHelmValues to false
The configurations required are:
prometheus.prometheusSpec.podMonitorSelectorNilUsesHelmValues=false
prometheus.prometheusSpec.serviceMonitorSelectorNilUsesHelmValues=false
The easiest way of doing this is to use helm upgrade ...
helm upgrade prometheus prometheus-community/kube-prometheus-stack \
--namespace prometheus  \
--set prometheus.prometheusSpec.podMonitorSelectorNilUsesHelmValues=false \
--set prometheus.prometheusSpec.serviceMonitorSelectorNilUsesHelmValues=false
Configure Service Discovery
Ensure that Prometheus is configured to discover the Ingress Nginx controller’s targets dynamically. This allows Prometheus to automatically discover and monitor new instances of the controller as they are created.
Step 2: Install Nginx Ingress Controller
helm repo add ingress-nginx https://kubernetes.github.io/ingress-nginxUpdate the dataset to create an application instance in the Kubernetes cluster:
helm repo updateInstall the controller in the standard configuration:
helm install ingress-nginx ingress-nginx/ingress-nginxRe-configure Ingress-Nginx Controller
The Ingress NGINX controller needs to be reconfigured for exporting metrics. This requires 3 additional configurations to the controller. These configurations are :
controller.metrics.enabled=true
controller.metrics.serviceMonitor.enabled=true
controller.metrics.serviceMonitor.additionalLabels.release="prometheus"
The easiest way of doing this is to helm upgrade
helm upgrade ingress-nginx ingress-nginx/ingress-nginx \
--namespace ingress-nginx \
--set controller.metrics.enabled=true \
--set controller.metrics.serviceMonitor.enabled=true \
--set controller.metrics.serviceMonitor.additionalLabels.release="prometheus"
Step 3: Install Grafana
Next, install Grafana and connect it to your Prometheus data source. Grafana offers a user-friendly interface for creating dashboards and visualizations.
Step 4: Design Grafana Dashboards
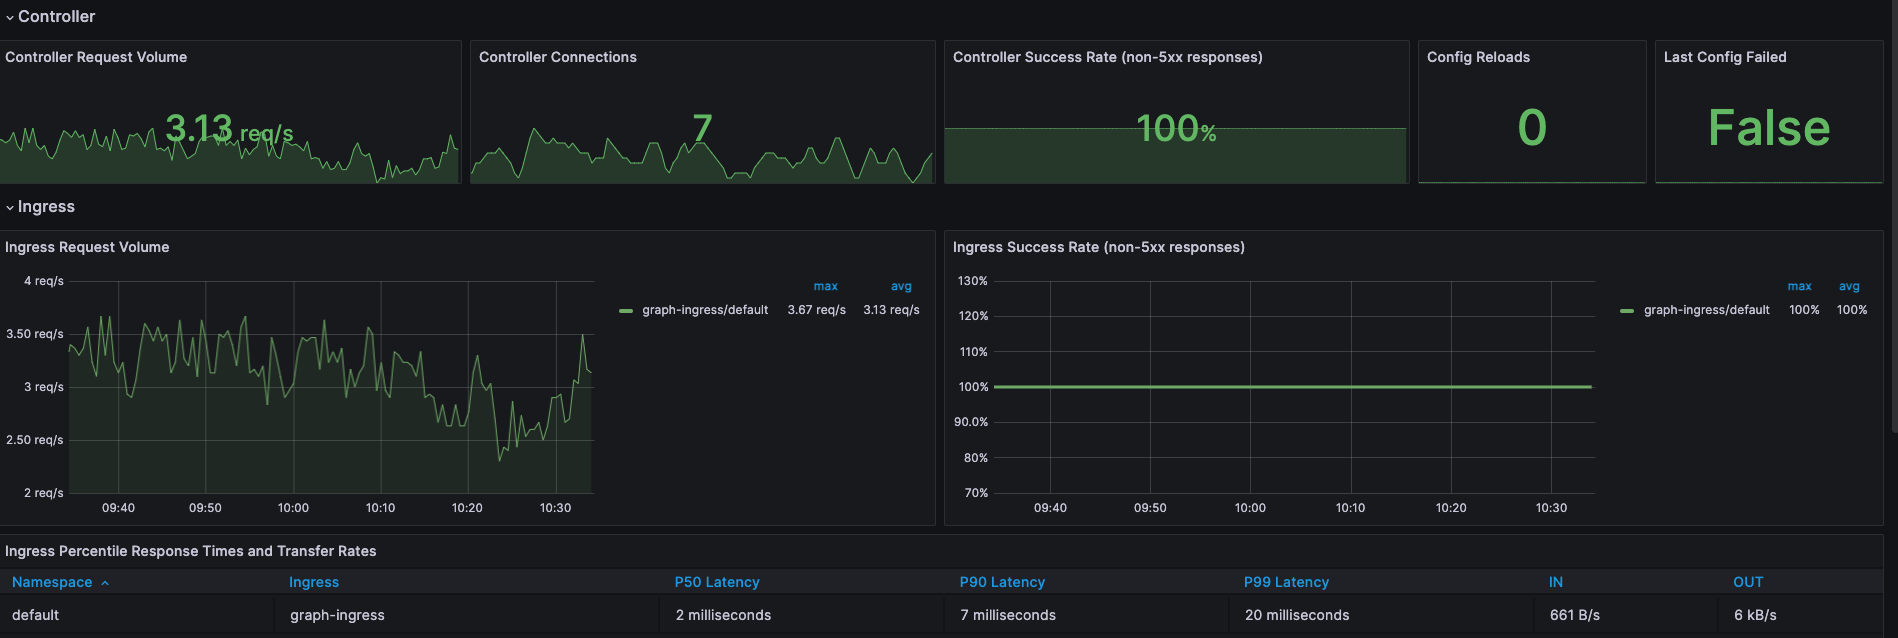
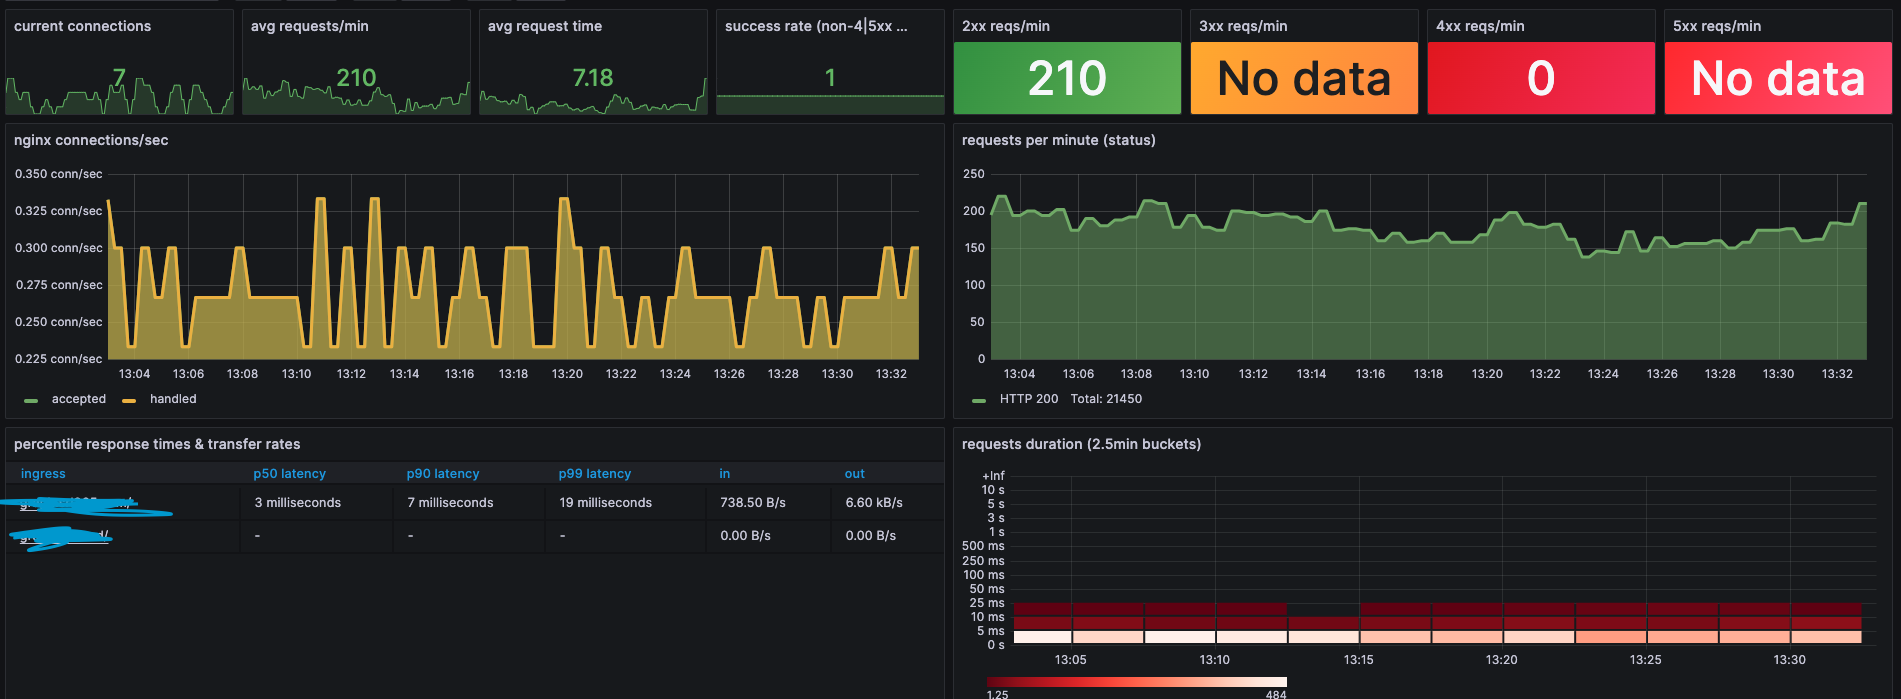
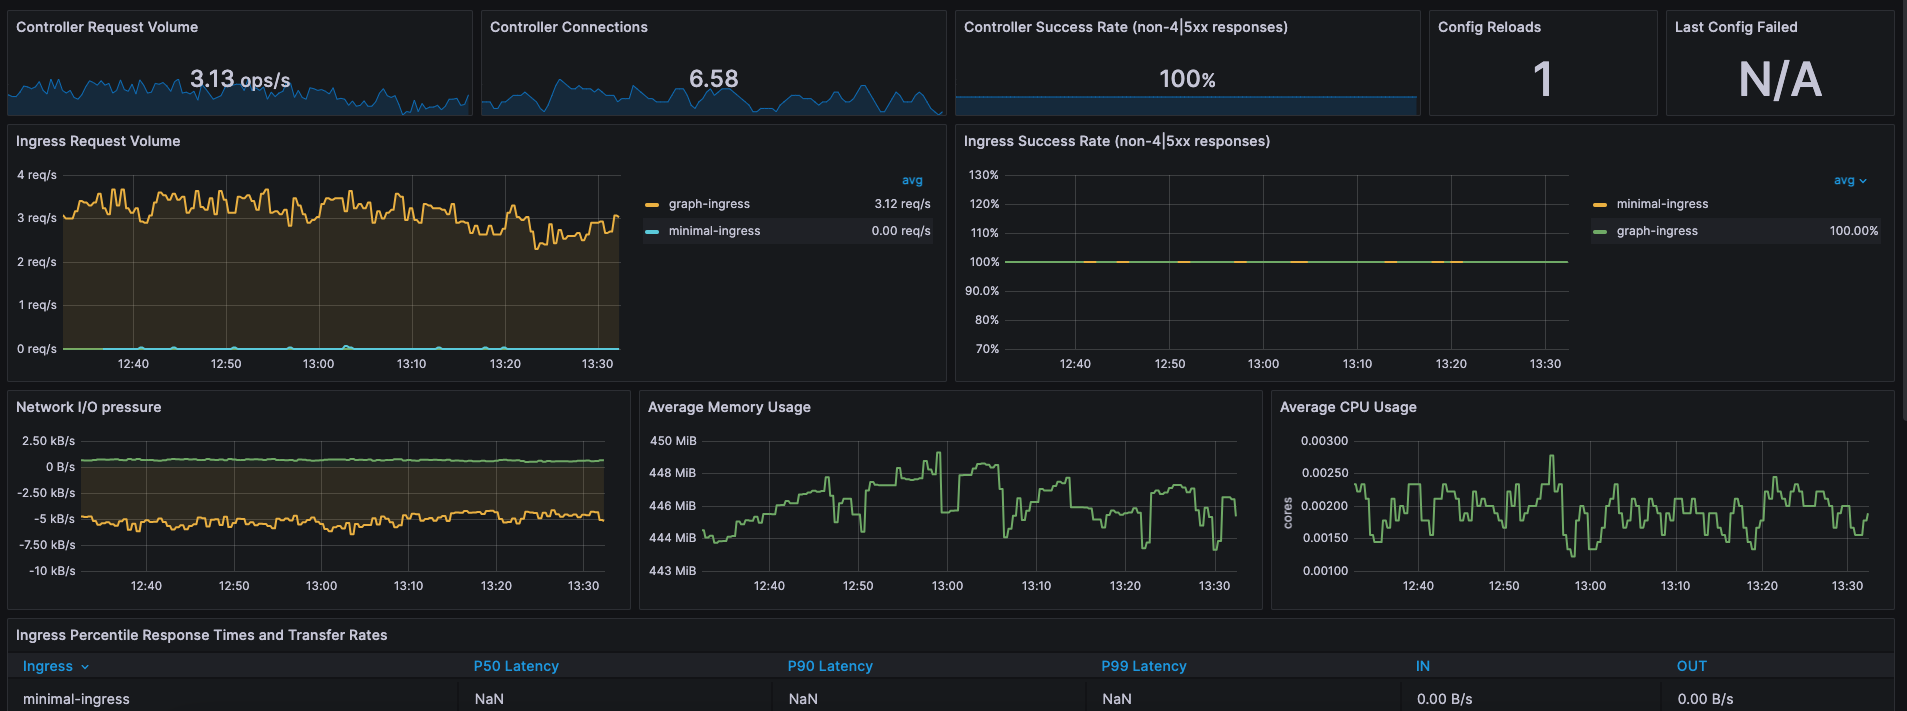
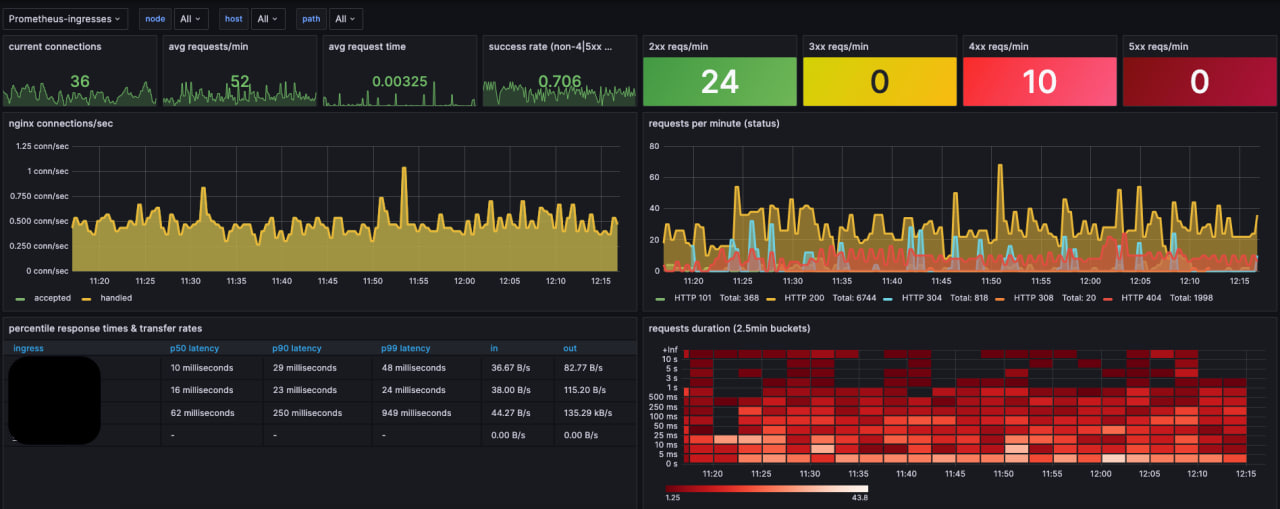
Design custom dashboards that provide insights into the Ingress Nginx controller’s performance. Include metrics such as request rates, response times, error rates, and resource utilisation. Visualise this data using graphs, charts, and tables.
Here you can download some of ingress grafana dasboards – ingress-dashboards