Prometheus is an open-source monitoring solution widely used for gathering and visualizing metrics from various systems. In a Kubernetes cluster, Prometheus can be a valuable tool for monitoring the health and performance of applications and infrastructure.
Let’s begin setting up Prometheus monitoring on your Kubernetes cluster, whether it’s MicroK8s or any other Kubernetes environment.
First, we need to install Helm, which is a package manager for Kubernetes applications. Helm version 3 is used here, but if you’re using Helm 2, you’ll also need to set up Helm server (Tiller).
To install Helm, follow these steps:
- Download the Helm installation script and install:
curl -fsSL -o get_helm.sh https://raw.githubusercontent.com/helm/helm/main/scripts/get-helm-3

chmod 700 get_helm.sh
./get_helm.sh
Now that Helm is installed, we can proceed with setting up Prometheus using Helm Charts. Helm Charts are pre-configured templates available on GitHub, which simplify the deployment process.
To install Prometheus using the default configuration, run:
helm install prometheus prometheus-community/prometheusTo access the Prometheus user interface (UI), you can forward the Prometheus pod port to your local machine:
kubectl port-forward <prometheus-pod-name> 9090:9090Now you can access the Prometheus UI in your browser at http://localhost:9090.
By following these steps, you can easily set up Prometheus monitoring on your Kubernetes cluster using Helm Charts.
The easiest way is to deploy Grafana with Prometheus is to use Prometheus stack.
The Kube Prometheus Stack is a comprehensive monitoring solution for Kubernetes clusters. It offers a collection of Kubernetes manifests, Grafana dashboards, Prometheus rules, and related documentation and scripts. This stack provides an all-in-one solution for monitoring your entire Kubernetes environment using Prometheus and the Prometheus Operator.
To install the Kube Prometheus Stack, the process is similar to what we have done previously with Helm. However, instead of using the generic Prometheus Helm Chart, we will use the dedicated Helm chart from the kube-prometheus-stack repository.
To install the Kube Prometheus Stack, execute the following command:
helm install prometheus prometheus-community/kube-prometheus-stackThis will deploy the entire monitoring stack, including Prometheus, Grafana, Alertmanager, kube-state-metrics, and node-exporter.
You can verify the deployment by checking the status of the deployed pods using the kubectl get pods command.
The Kube Prometheus Stack provides a powerful monitoring solution that covers various aspects of your Kubernetes cluster. It comes with pre-configured dashboards, alerting capabilities, and integrations with other Kubernetes components. By using this stack, you can easily set up end-to-end monitoring for your Kubernetes environment without the need for extensive manual configuration.
If you want to customize the configuration, create a custom YAML file (e.g., prometheus.yaml). Copy the default values from the Helm Chart and modify them as per your requirements. Then, install Prometheus using your custom value.yaml file:
grafana:
  enabled: false
  persistence:
    enabled: true
alertmanager:
  enabled: false
kubeStateMetrics:
  enabled: false
nodeExporter:
  enabled: false
helm install -f prometheus.yaml prometheus prometheus-community/prometheusor upgrade the existing installation with:
helm upgrade -f values.yaml prometheus prometheus-community/kube-prometheus-stackRemember to explore the documentation and resources provided by the Kube Prometheus Stack repository to make the most of this monitoring solution.
You can also use single yaml file
grafana.yamlto deploy Grafana:
---
apiVersion: v1
kind: PersistentVolumeClaim
metadata:
  name: grafana-pvc
spec:
  accessModes:
    - ReadWriteOnce
  resources:
    requests:
      storage: 1Gi
---
apiVersion: apps/v1
kind: Deployment
metadata:
  labels:
    app: grafana
  name: grafana
spec:
  selector:
    matchLabels:
      app: grafana
  template:
    metadata:
      labels:
        app: grafana
    spec:
      securityContext:
        fsGroup: 472
        supplementalGroups:
          - 0
      containers:
        - name: grafana
          image: grafana/grafana:9.1.0
          imagePullPolicy: IfNotPresent
          ports:
            - containerPort: 3000
              name: http-grafana
              protocol: TCP
          readinessProbe:
            failureThreshold: 3
            httpGet:
              path: /robots.txt
              port: 3000
              scheme: HTTP
            initialDelaySeconds: 10
            periodSeconds: 30
            successThreshold: 1
            timeoutSeconds: 2
          livenessProbe:
            failureThreshold: 3
            initialDelaySeconds: 30
            periodSeconds: 10
            successThreshold: 1
            tcpSocket:
              port: 3000
            timeoutSeconds: 1
          resources:
            requests:
              cpu: 250m
              memory: 750Mi
          volumeMounts:
            - mountPath: /var/lib/grafana
              name: grafana-pv
      volumes:
        - name: grafana-pv
          persistentVolumeClaim:
            claimName: grafana-pvc
---
apiVersion: v1
kind: Service
metadata:
  name: grafana
spec:
  ports:
    - port: 3000
      protocol: TCP
      targetPort: http-grafana
  selector:
    app: grafana
  sessionAffinity: None
type: LoadBalancer- Run the following command:
kubectl apply -f grafana.yaml - Check that it worked by running the following:
kubectl port-forward service/grafana 3000:3000 - Navigate to
localhost:3000in your browser. You should see a Grafana login page. - Use
adminfor both the username and password to login.
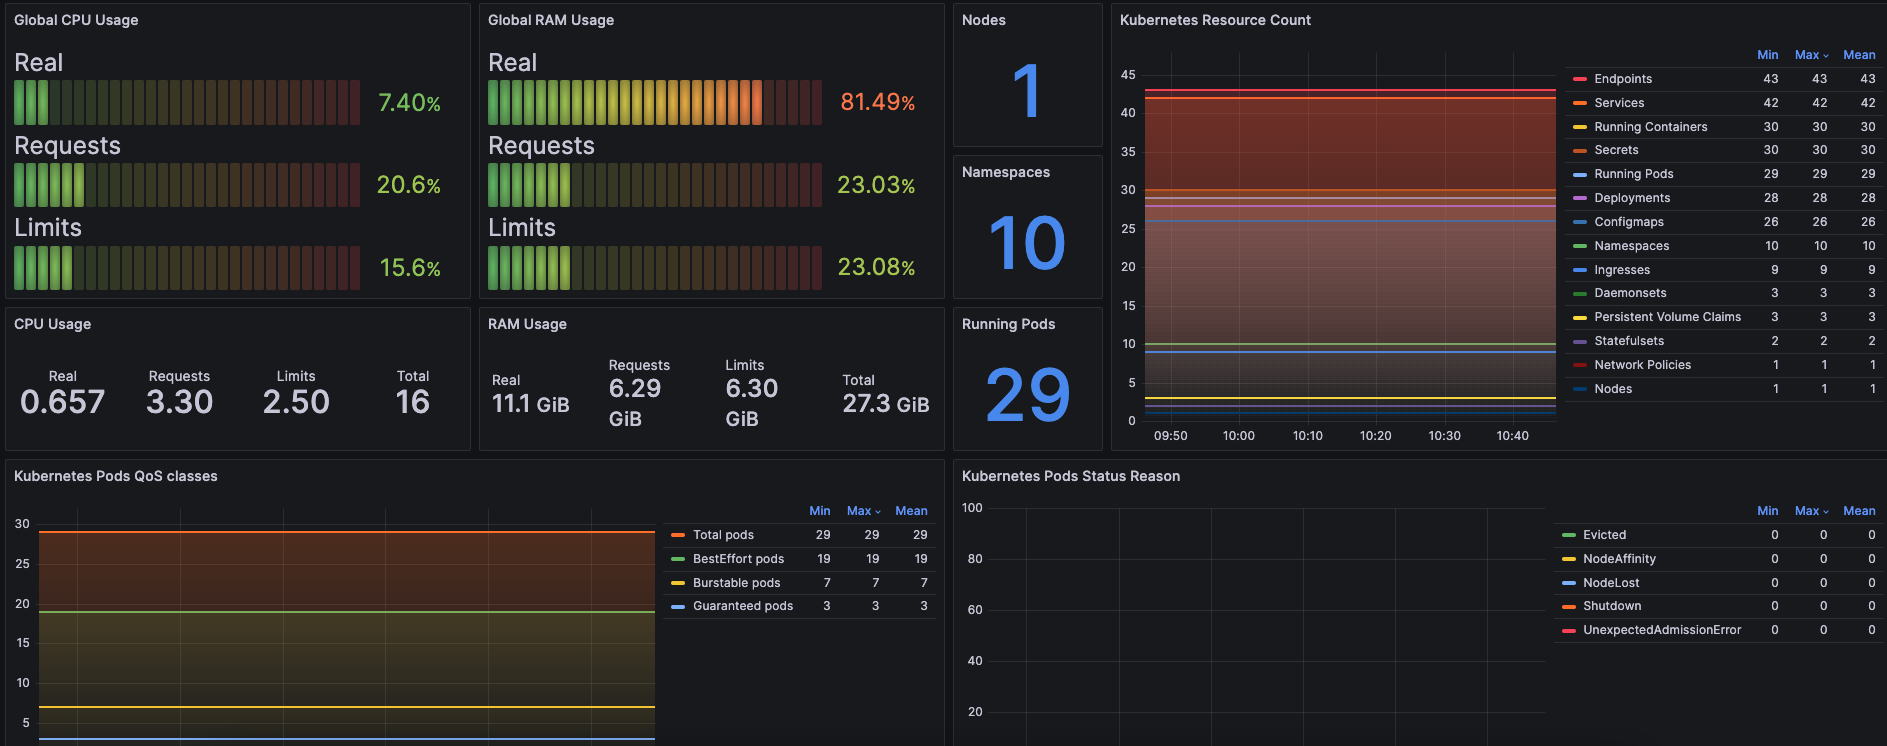
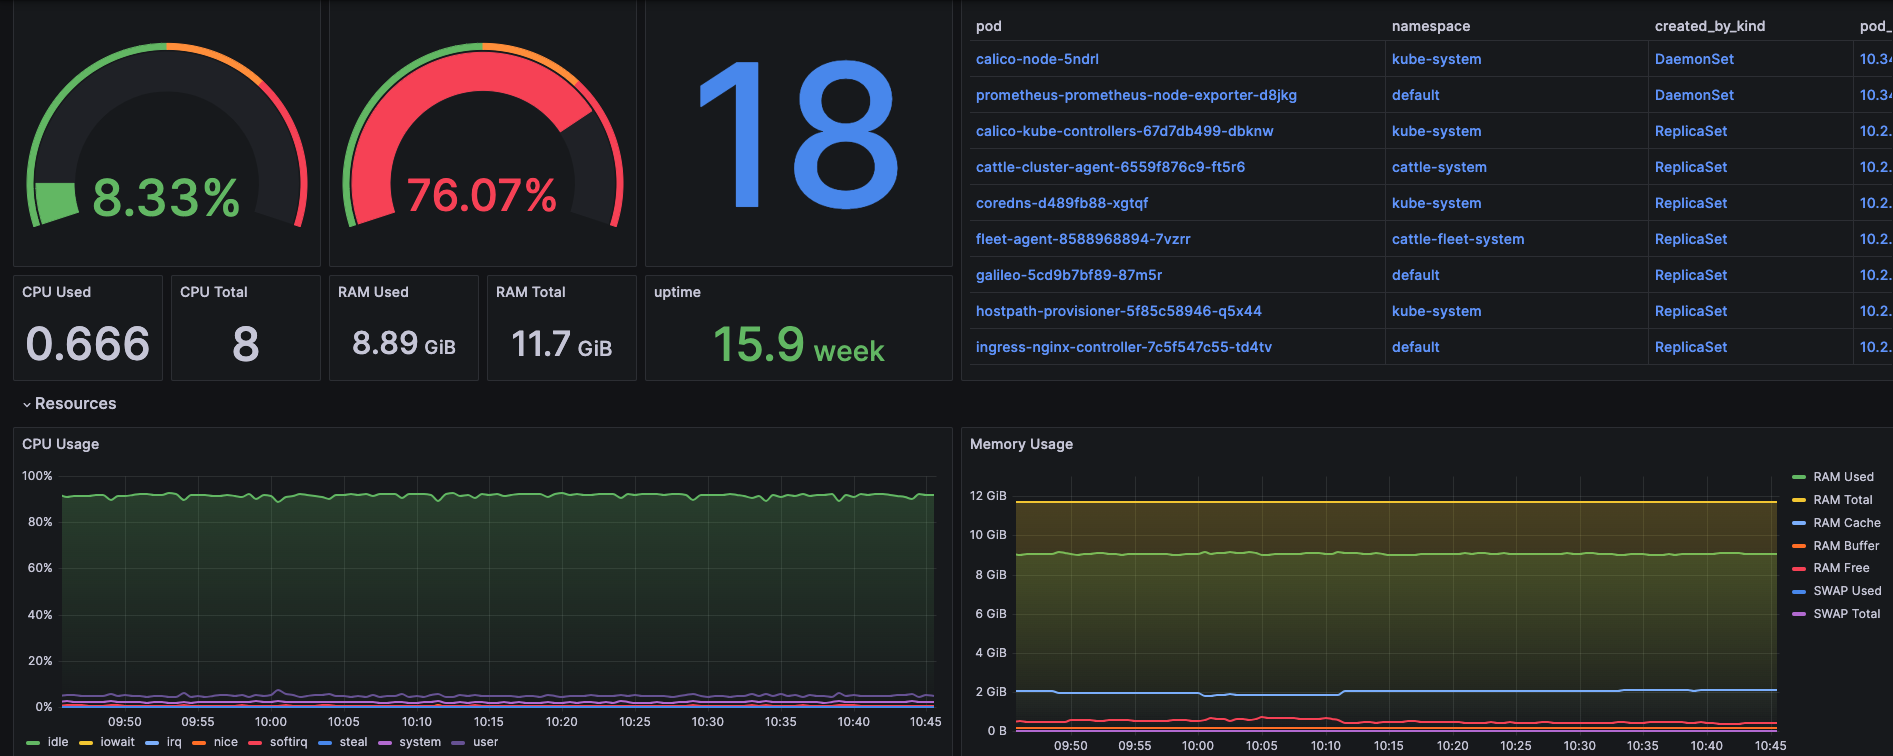
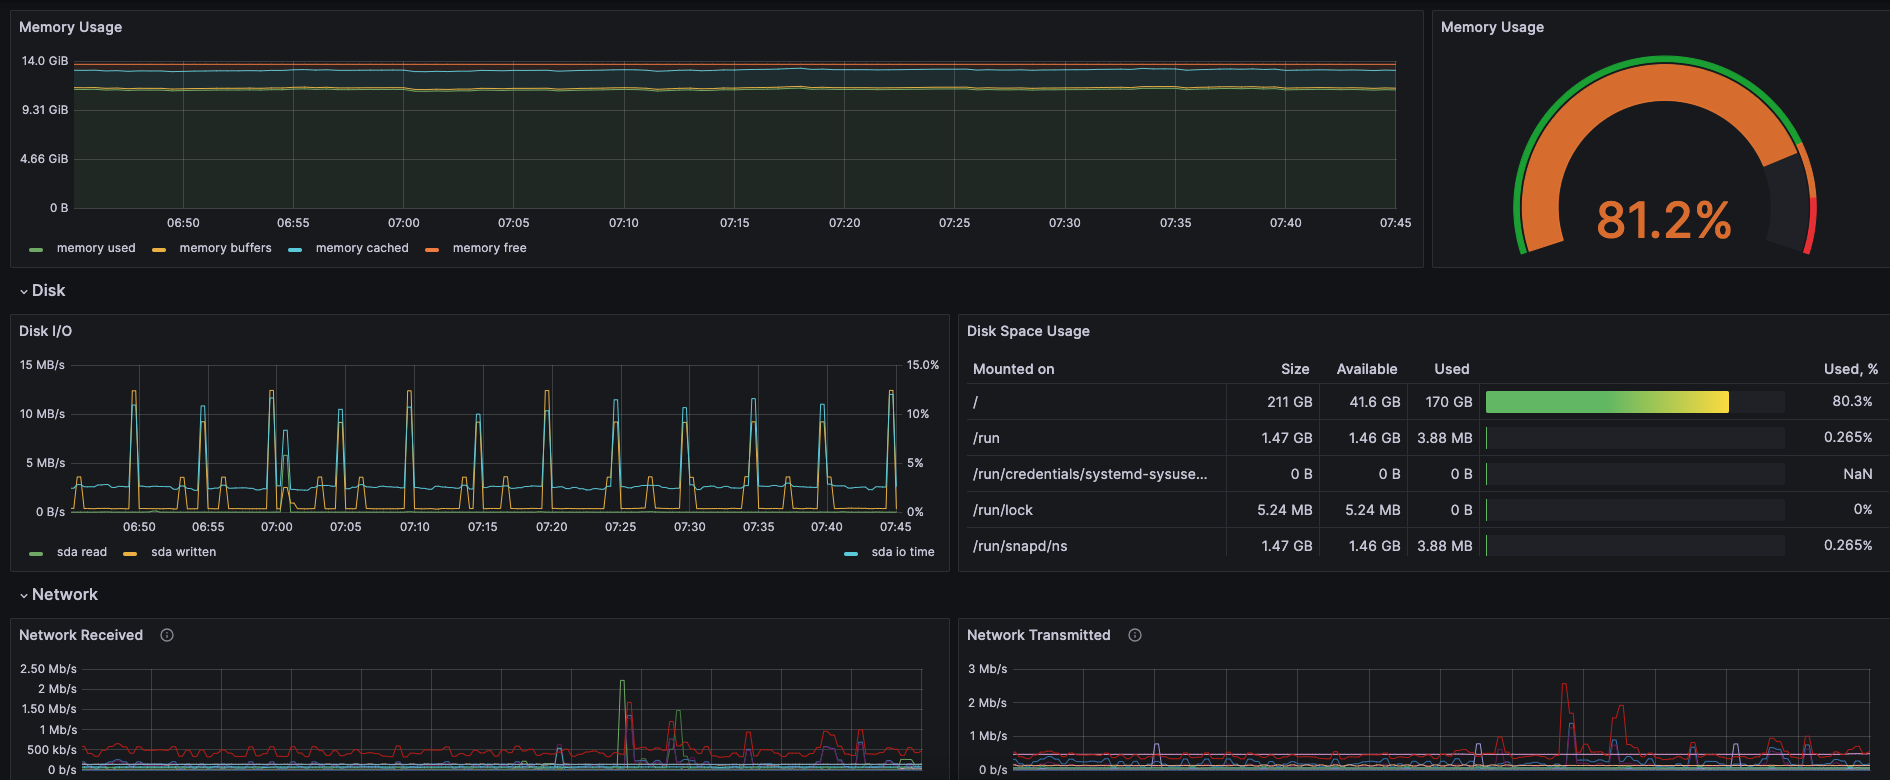
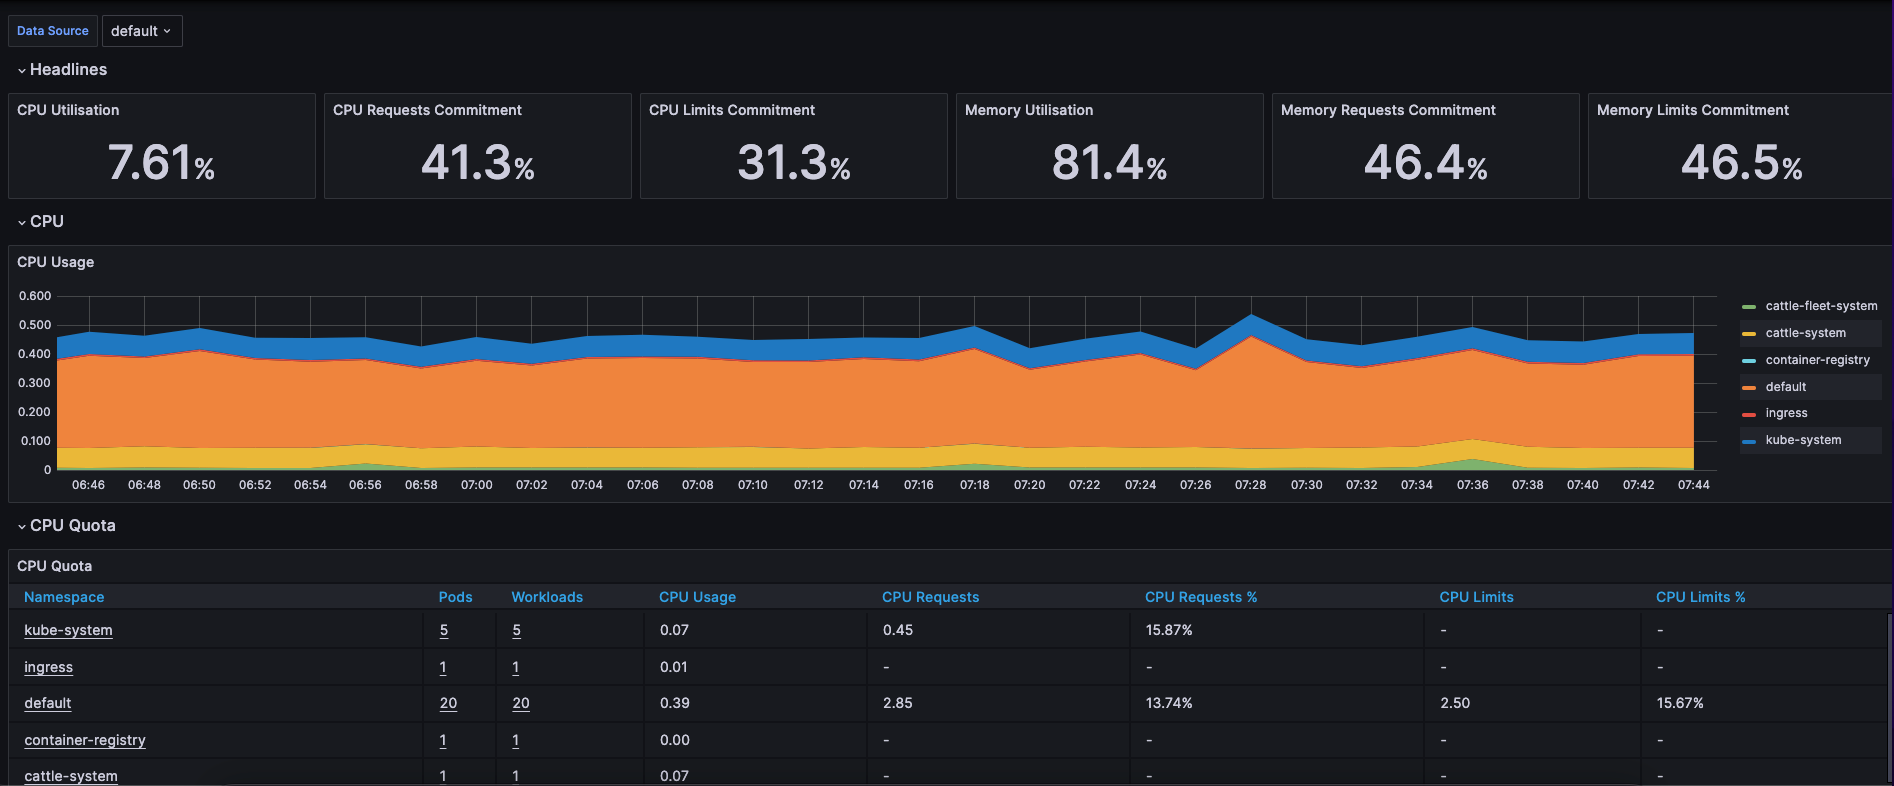
The result looks like this:
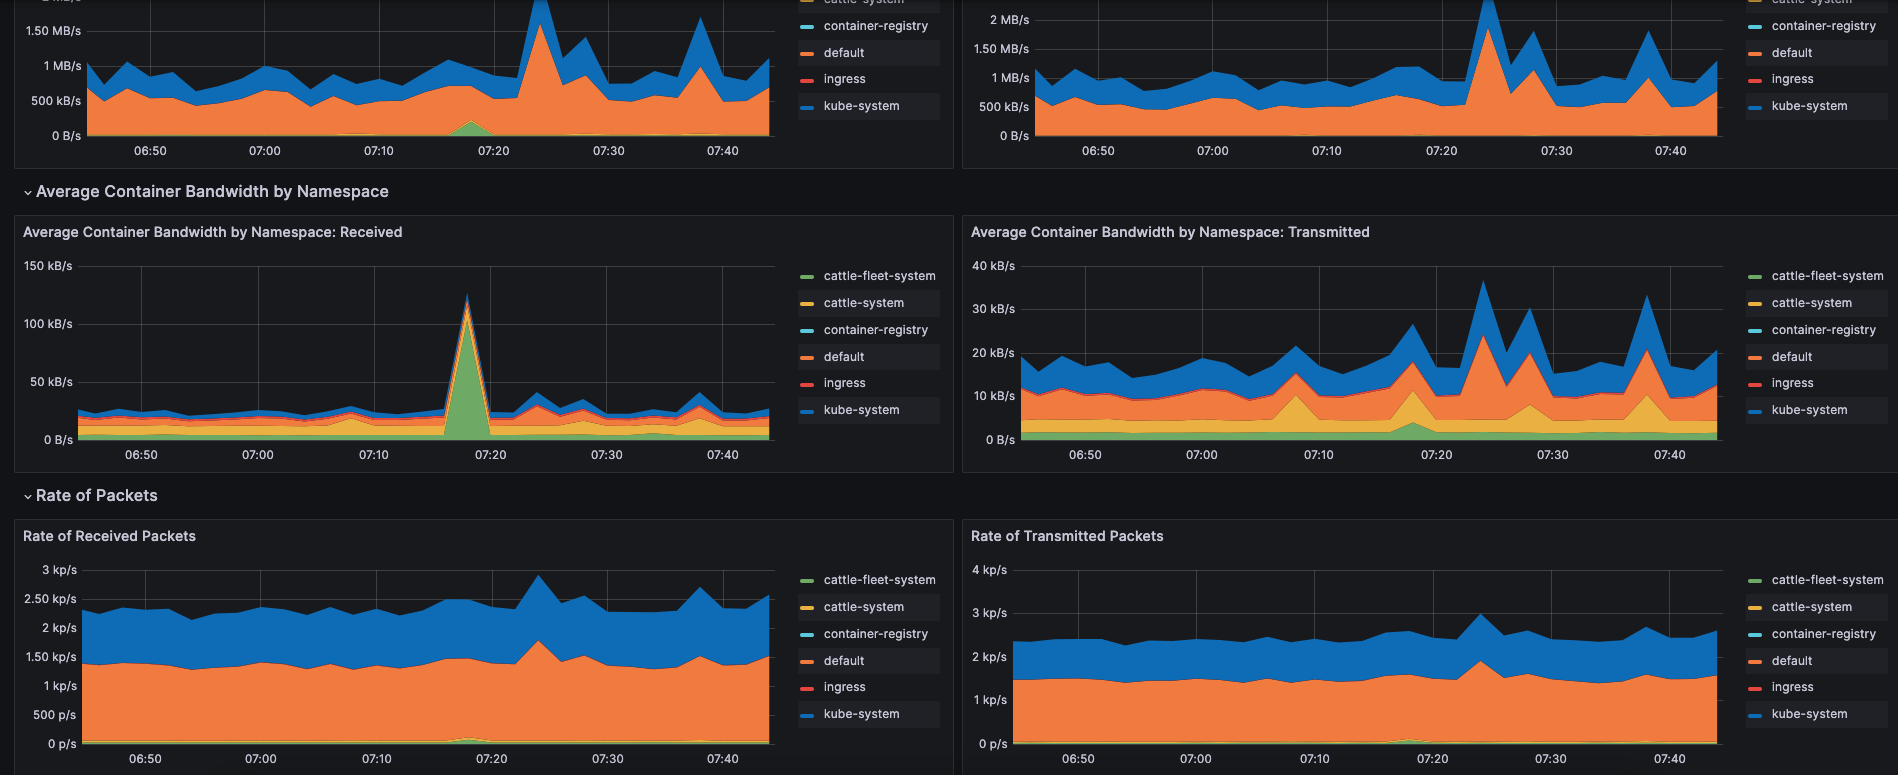
You can download set of dashboards to get graphs like this – k8s-dashboards
Additionally you can set up Telegram alerts in Grafana:
- Go to the Alerting section in Grafana.
- Create a new notification channel by clicking on “New Channel”.
- Give the channel a name (e.g., “Telegram”) and select “Telegram” as the Type.
- Enter the Telegram Chat ID where you want to receive the alerts. You can find your Chat ID by starting a conversation with your bot and accessing the following URL in your browser:
https://api.telegram.org/bot<YourBotToken>/getUpdates. - Save the channel configuration.
- Configure Alerts and Rules in Grafana:
- Create or edit a dashboard in Grafana that contains the metrics or visualizations you want to monitor.
- Click on the “Alert” tab in the dashboard and create a new alert rule.
- Configure the conditions, thresholds, and other parameters for your alert rule.
- In the “Send to” section, select the Telegram channel you configured earlier.
- Save the alert rule.
- Test the Telegram Alert:
- To ensure everything is set up correctly, you can manually trigger an alert by exceeding the defined thresholds.
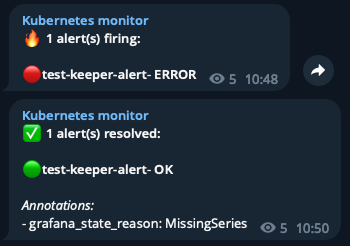
If the alert condition is met, you should receive a notification in your configured Telegram chat with the details of the triggered alert.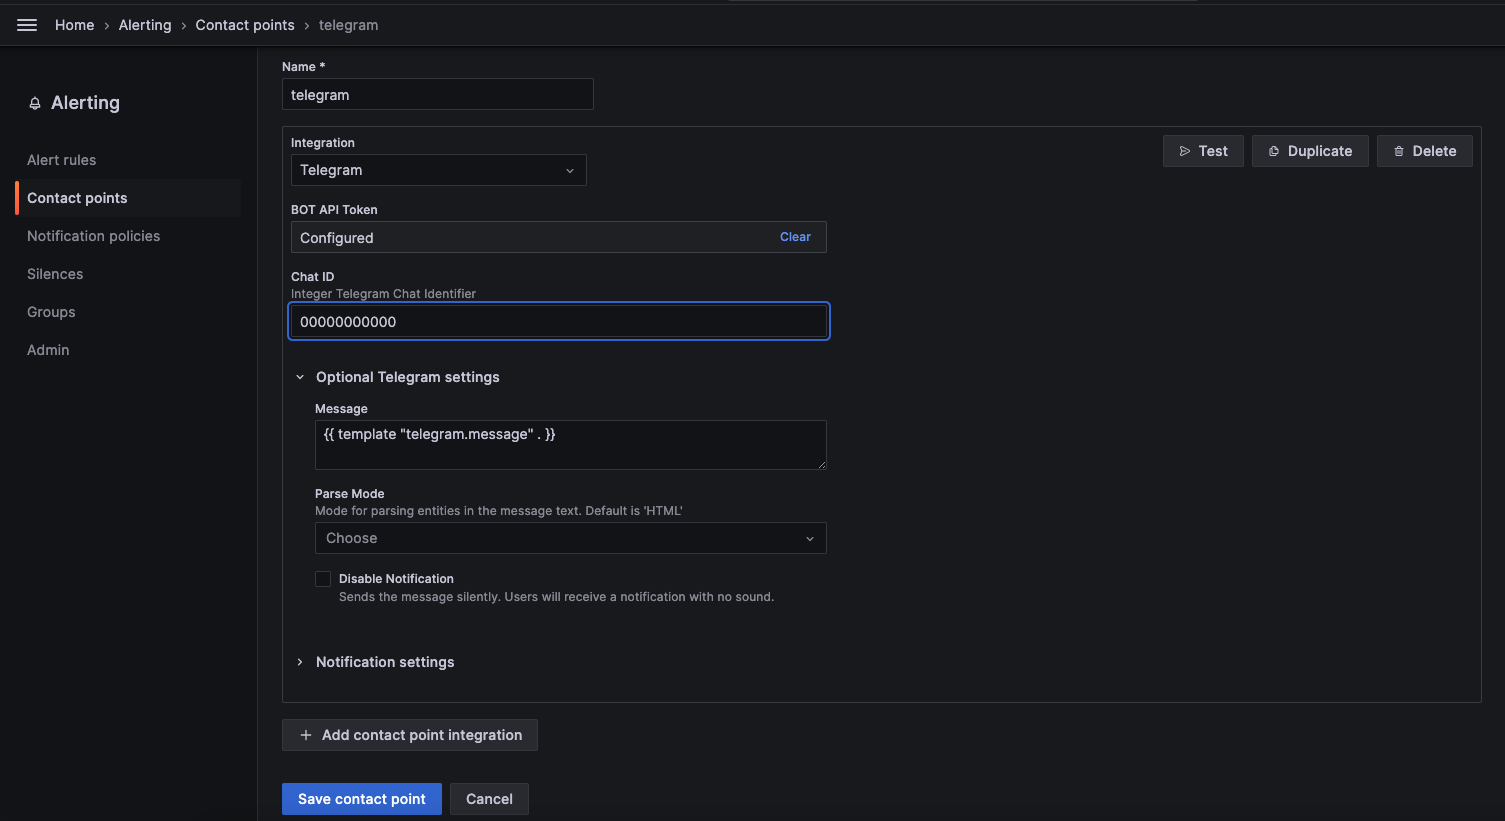
To use custom telegram message template , create new template in grafana Contact points and paste the code below:
{{- /* Telegram message to use: {{ template "telegram.message" . }} */ -}}
{{ define "__alerts_list" -}}
{{ range . }}
{{ if ne (index .Labels "alertname") "" -}}
{{ if eq .Status "firing" }}🔴{{ else }}🟢{{ end }}
    {{- if ne (index .Labels "severity") "" -}}
        P{{ index .Labels "severity" }} {{ end -}}
{{ index .Labels "alertname" }}
    {{- if eq .Status "firing" -}}
        - ERROR
    {{- else -}}
        - OK
    {{- end }}
{{ end -}}
{{ if len .Annotations }}
Annotations:
{{ range .Annotations.SortedPairs -}}
- {{ .Name }}: {{ .Value }}
{{ end -}}
{{ end }}
{{- end -}} {{- /* range */ -}}
{{- end -}} {{- /* define __alerts_list */ -}}

{{ define "__telegram.title" -}}
{{ if ne (index .CommonLabels "severity") "" }} P{{ index .CommonLabels "severity" }} {{ end -}}
{{ if ne (index .CommonLabels "alertname") "" -}}
    [{{ index .CommonLabels "alertname" }}]
{{- end -}}
{{- end -}}{{- /* define __telegram */ -}}

{{ define "telegram.message" }}
{{ if gt (len .Alerts.Firing) 0 }}
🔥 {{ len .Alerts.Firing }} alert(s) firing:
{{ template "__alerts_list" .Alerts.Firing }}{{ end -}}
{{ if gt (len .Alerts.Resolved) 0 }}
  ✅ {{ len .Alerts.Resolved }} alert(s) resolved:
{{ template "__alerts_list" .Alerts.Resolved }}{{ end }}
{{- end -}}
Then go to Contact points – > Select ‘Telegram’ – > Optional Telegram Settings and paste {{ template “telegram.message” . }}
Here’s the result: