To begin, launch an EC2 instance using the Amazon Linux 2 Image and keep the default specifications. We will configure it later.
Create an IAM role for the EC2 instance with “CloudWatchFullAccess” using IAM. Although this permission is more than required, we will use it for this tutorial.
Configure the EC2 instance by modifying the default security group to allow inbound access only from your IP, and ensure that outbound rules permit all traffic to any IP.
Then, assign the IAM role created earlier to the EC2 instance to enable communication with CloudWatch.
Ssh into the instance and install some libraries.
sudo yum install -y perl-Switch perl-DateTime perl-Sys-Syslog perl-LWP-Protocol-https perl-Digest-SHA.x86_64Download monitoring scripts.
curl https://aws-cloudwatch.s3.amazonaws.com/downloads/CloudWatchMonitoringScripts-1.2.2.zip -OOpen crontab and paste the command provided to send data to CloudWatch every minute.
*/1 * * * * root /home/ec2-user/aws-scripts-mon/mon-put-instance-data.pl --mem-util --mem-used --mem-avail --disk-space-util --disk-space-used --disk-space-avail --disk-path=/To monitor the metrics, navigate to CloudWatch in AWS and select “Metrics” from the left menu.
Under Custom Namespaces, click on “System/Linux” and select the available metrics
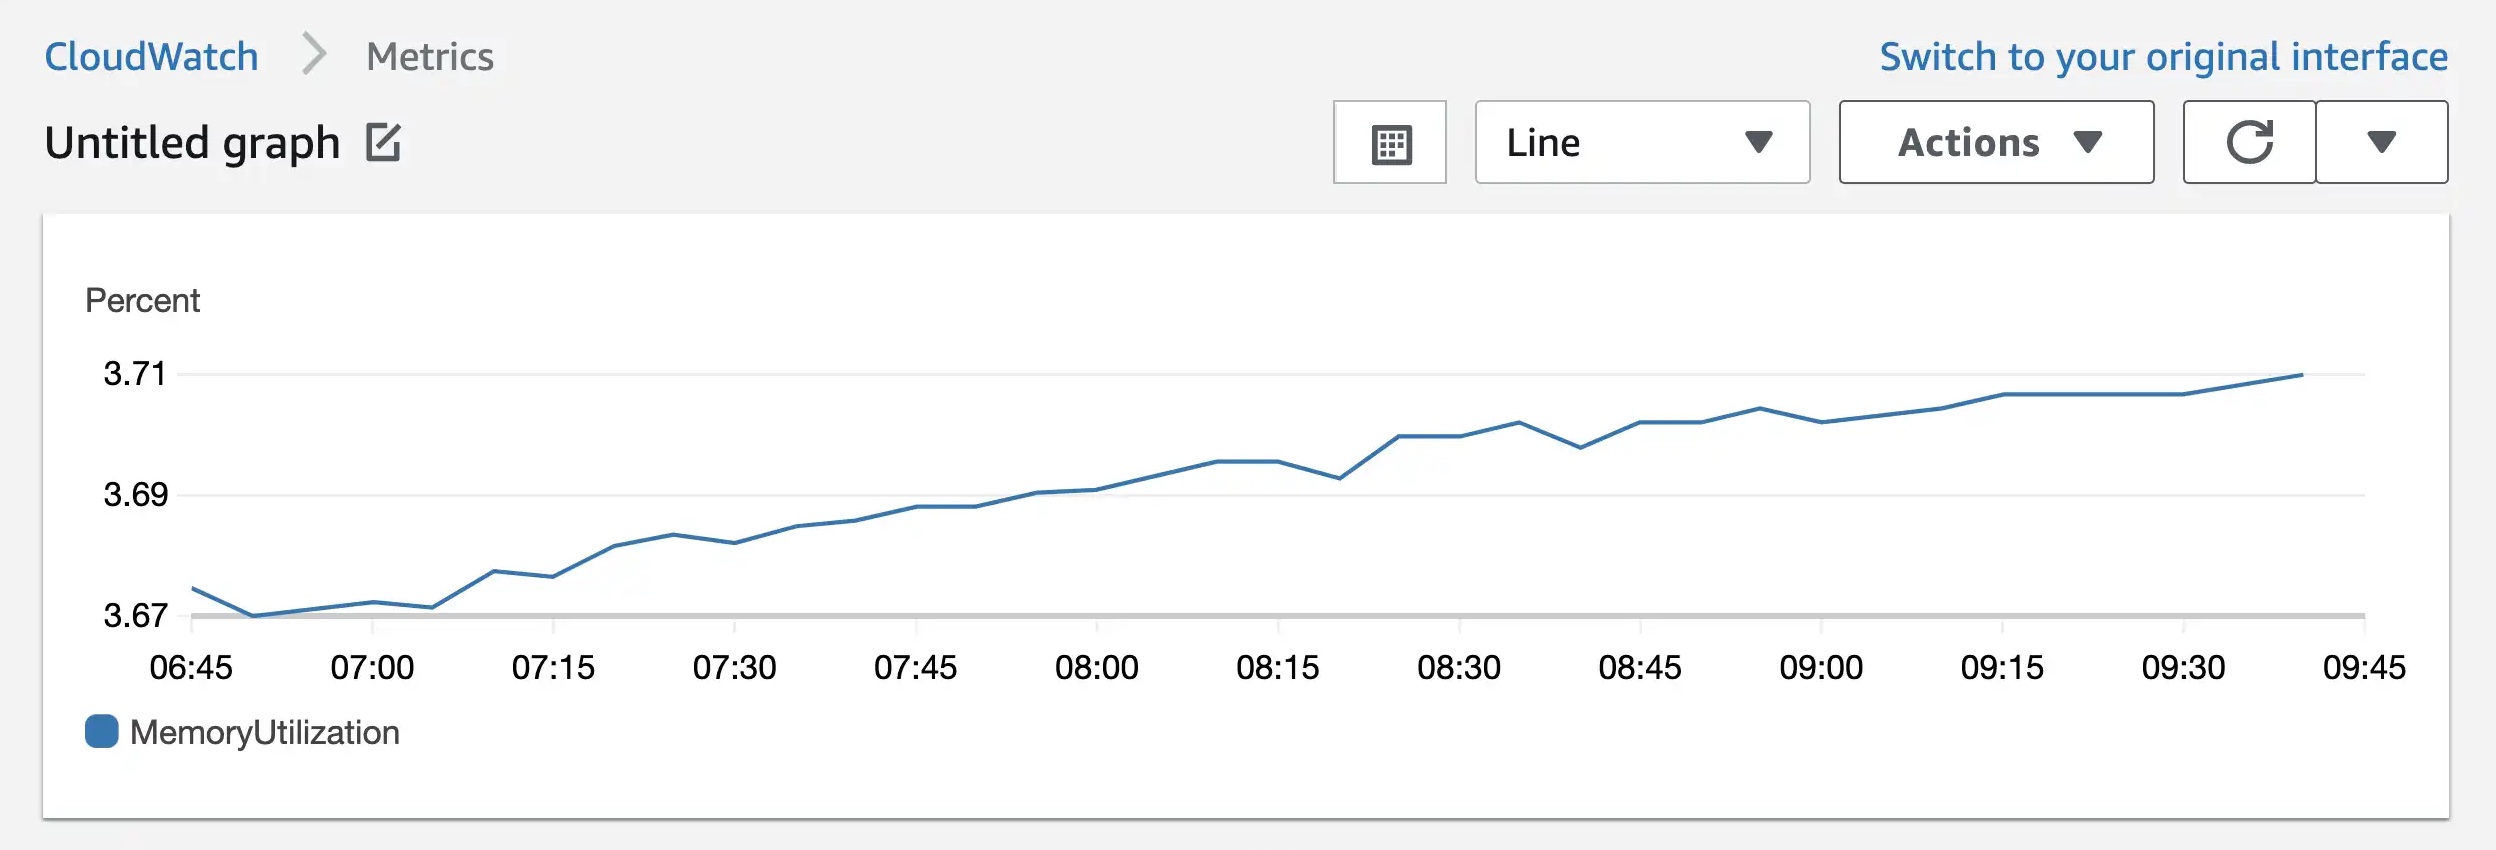
Finally, tick off the available metrics under “Graphed metrics” to start monitoring memory and hard disk utilization on the chart. Note that the data shown may be limited to a few minutes.


