Introduction
Looking to set up highly available, scalable, and resilient storage for your Kubernetes workloads? Rook Ceph makes it easy to run Ceph storage systems natively inside Kubernetes. In this guide, we’ll walk through how to deploy Rook Ceph in a Kubernetes cluster, configure a shared CephFS filesystem, access the Ceph dashboard, monitor your cluster with Prometheus, and even copy files to your Persistent Volume Claims (PVCs).
Prerequisites
Before deploying Rook Ceph, ensure your Kubernetes cluster meets the following prerequisites, as described in the official Rook documentation:
- A Kubernetes cluster (v1.21 or higher recommended)
- Raw block devices or partitions attached to your nodes
- Helm (optional, for advanced installs)
- Enough resources (at least 3 nodes with sufficient CPU and memory)
Step 1: Install Rook Ceph in Kubernetes
Clone the Rook repository and apply the required manifests:
git clone --single-branch --branch v1.17.0 https://github.com/rook/rook.git
cd rook/deploy/examples
kubectl create -f crds.yaml -f common.yaml -f operator.yaml
kubectl create -f csi-operator.yaml
kubectl create -f cluster.yamlThis will deploy the Rook operator and a simple Ceph cluster in your Kubernetes environment.
Step 2: Create a Shared Filesystem (CephFS)
To enable shared storage for multiple pods, use CephFS. Apply the following manifest:
apiVersion: ceph.rook.io/v1
kind: CephFilesystem
metadata:
  name: myfs
  namespace: rook-ceph
spec:
  metadataPool:
    replicated:
      size: 3
  dataPools:
    - name: replicated
      replicated:
        size: 3
  preserveFilesystemOnDelete: true
  metadataServer:
    activeCount: 1
activeStandby: truekubectl create -f filesystem.yamlOnce the filesystem is created, confirm its status:
kubectl -n rook-ceph get cephfilesystemYou can now use this filesystem in a Kubernetes PersistentVolumeClaim (PVC) for applications like a container registry, NGINX, or any workload requiring shared access.
Step 3: Provision storage
Save this storage class definition as storageclass.yaml:
apiVersion: storage.k8s.io/v1
kind: StorageClass
metadata:
  name: rook-cephfs
# Change "rook-ceph" provisioner prefix to match the operator namespace if needed
provisioner: rook-ceph.cephfs.csi.ceph.com
parameters:
  # clusterID is the namespace where the rook cluster is running
  # If you change this namespace, also change the namespace below where the secret namespaces are defined
  clusterID: rook-ceph

  # CephFS filesystem name into which the volume shall be created
  fsName: myfs

  # Ceph pool into which the volume shall be created
  # Required for provisionVolume: "true"
  pool: myfs-replicated

  # The secrets contain Ceph admin credentials. These are generated automatically by the operator
  # in the same namespace as the cluster.
  csi.storage.k8s.io/provisioner-secret-name: rook-csi-cephfs-provisioner
  csi.storage.k8s.io/provisioner-secret-namespace: rook-ceph
  csi.storage.k8s.io/controller-expand-secret-name: rook-csi-cephfs-provisioner
  csi.storage.k8s.io/controller-expand-secret-namespace: rook-ceph
  csi.storage.k8s.io/node-stage-secret-name: rook-csi-cephfs-node
  csi.storage.k8s.io/node-stage-secret-namespace: rook-ceph

allowVolumeExpansion: true
reclaimPolicy: Deletekubectl create -f deploy/examples/csi/cephfs/storageclass.yamlStep 4: Create PVC to test bounding
apiVersion: v1
kind: PersistentVolumeClaim
metadata:
  name: cephfs-pvc
  namespace: kube-system
spec:
  accessModes:
  - ReadWriteMany
  resources:
    requests:
      storage: 1Gi
storageClassName: rook-cephfskubectl create -f pvc.yamlStep 4: Deploy Ceph Toolbox for Troubleshooting
Install the Ceph toolbox to inspect and manage your Ceph cluster:
kubectl create -f /rook/deploy/example/toolbox.yamlAccess the toolbox pod:
kubectl -n rook-ceph exec -it deploy/rook-ceph-tools -- bashInside the toolbox, you can run commands like ceph status and ceph osd tree to get detailed information about your cluster.
Step 5: Copy Files to a PVC (Using a Temporary Pod) *optional
To copy files into a PVC, use a temporary pod:
apiVersion: v1
kind: Pod
metadata:
  name: copy-files
spec:
  containers:
  - name: copy
    image: busybox
    command: ["/bin/sh", "-c", "sleep 3600"]
    volumeMounts:
    - name: data
      mountPath: /data
  volumes:
  - name: data
    persistentVolumeClaim:
      claimName: <your-pvc-name>
restartPolicy: NeverReplace <your-pvc-name> with the actual name of your PVC. Once the pod is running, you can copy files into the volume using the following commands:
kubectl cp file1.yml copy-files:/data/file1.yml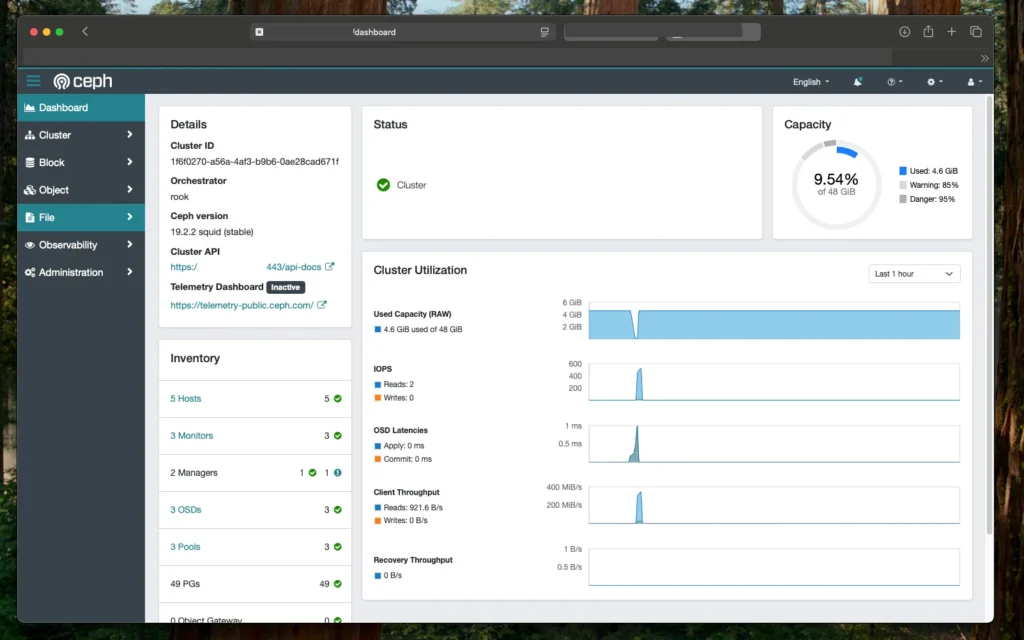
kubectl cp file2.yml copy-files:/data/file2.ymlStep 6: Enable and Expose the Ceph Dashboard
If the Ceph dashboard is not active, enable it:
kubectl -n rook-ceph patch cephcluster rook-ceph --type merge -p '{"spec": {"dashboard": {"enabled": true}}}'Expose the dashboard service using a NodePort:
kubectl -n rook-ceph patch svc rook-ceph-mgr-dashboard -p '{"spec": {"type": "NodePort"}}'
kubectl -n rook-ceph get svc rook-ceph-mgr-dashboardYou’ll see an external port (NodePort) that you can access via http://<node-ip>:<nodeport>. Log in with the credentials found via:
kubectl -n rook-ceph get secret rook-ceph-dashboard-password -o jsonpath="{['data']['password']}" | base64 --decodeStep 7: Enable Prometheus Monitoring
To monitor your Ceph cluster with Prometheus:
- Clone the Rook repo and navigate to the monitoring directory:
git clone --single-branch --branch v1.17.0 https://github.com/rook/rook.git
cd rook/deploy/examples/monitoring- Create the service monitor and Prometheus resources:
kubectl create -f https://raw.githubusercontent.com/coreos/prometheus-operator/v0.82.0/bundle.yaml
kubectl create -f service-monitor.yaml
kubectl create -f exporter-service-monitor.yaml
kubectl create -f prometheus.yaml
kubectl create -f prometheus-service.yaml- Ensure the Prometheus pod is running:
kubectl -n rook-ceph get pod prometheus-rook-prometheus-0- To configure the Prometheus endpoint for the Ceph dashboard, retrieve the Prometheus URL:
echo "http://$(kubectl -n rook-ceph -o jsonpath={.status.hostIP} get pod prometheus-rook-prometheus-0):30900"- Update your CephCluster CR with the Prometheus endpoint:
spec:
  dashboard:
    prometheusEndpoint: http://192.168.61.204:30900
prometheusEndpointSSLVerify: true6. To edit the CephCluster configuration manually:
kubectl -n rook-ceph edit cephcluster rook-cephThis allows the Ceph dashboard to fetch and display metrics from Prometheus.
Conclusion
You’ve now set up a full-featured Rook Ceph deployment in Kubernetes, complete with shared storage using CephFS, a troubleshooting toolbox, file copy methods to PVCs, a web-accessible dashboard, and integrated Prometheus monitoring. This setup is perfect for production-grade clusters that demand high reliability and observability.