
Last updated on August 14, 2021
With PRTG monitoring you can do various things, today I’ll show you how to create custom SSH sensor and monitor response time of server/website or anything you want.
In order to do so, you need to create two files:
1. Create a new file, curl-format.txt, and paste in:
     time_namelookup:  %{time_namelookup}s\n
        time_connect:  %{time_connect}s\n
     time_appconnect:  %{time_appconnect}s\n
    time_pretransfer:  %{time_pretransfer}s\n
       time_redirect:  %{time_redirect}s\n
  time_starttransfer:  %{time_starttransfer}s\n
                     ----------\n
          time_total:  %{time_total}s\n
2. Create ssh scipt, responsetime.sh, and paste in:
#!/bin/bash

time=$(curl -w "@/var/prtg/scripts/curl-format.txt" -o /dev/null -s "127.0.0.1:80" |grep time_total |cut -c 24-|cut -d "s" -f1)
ms=$(echo "$time 1000" |awk '{print $1 * $2}')
echo "0:$ms:OK"
! make script executable by:
chmod +x responsetime.sh
# curl-format.txt is needed to set time variables for curl reuquest
# in responsetime.sh we make request to 127.0.0.1 port 80, it outputs in seconds, so then we multiple the output on 1000 to get the output in ms
3. Move curl-format.txt and responsetime.sh to /var/prtg/scripts folder on the target server and navigate to your PRTG web
4. Add new SSH script sensor to your device
- Type the name of new sensor
- In SENSOR SETTINGS -> Script – choose our script responsetime.sh
- Value Type – Float (!it’s important to choose float, otherwise sensor wont work)
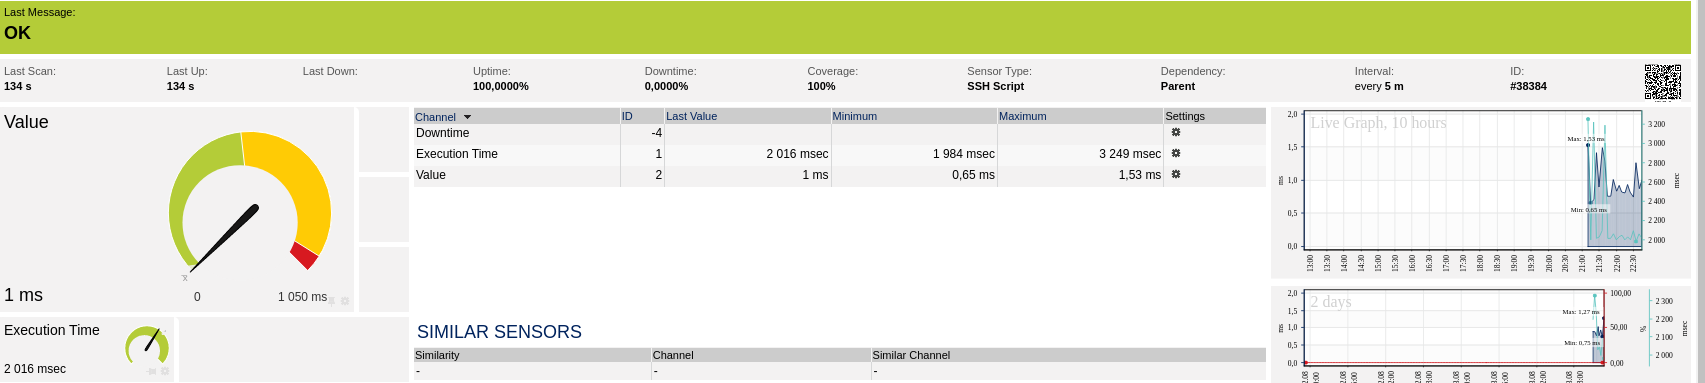
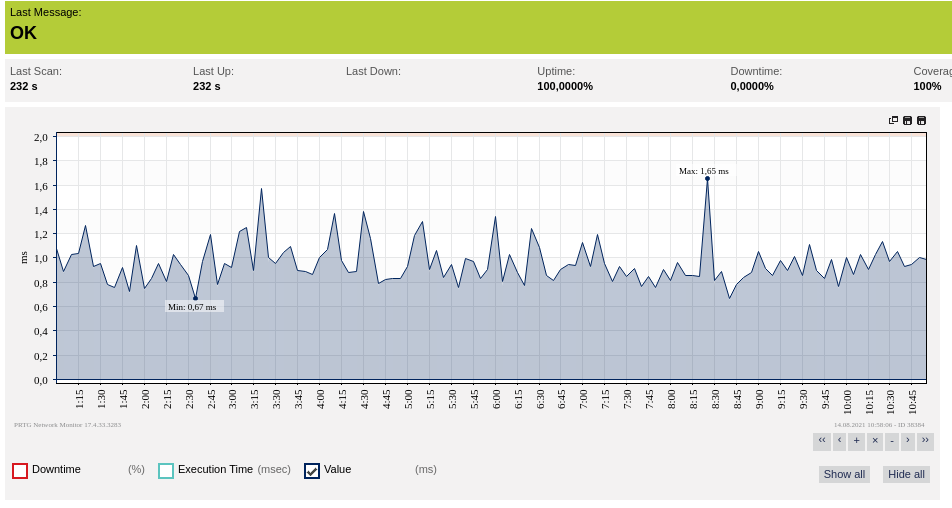
- ContinueThe result will look as follow:
- Do not forget to set sensor limits and you are good to go.